In this guide
- Run the check in five steps
- Start with total sales, not ad sales
- Track TACoS, because ACoS can't see the whole account
- Find out how much of your sales the ads are carrying
- Strip out your brand name before you judge ROAS
- Add up the search terms that never sold
- Measure profit after ads and fees
- Price the placements nobody chose
- What you can't fix
- Your 30-minute agency checklist
- Where we fit
- Authoritative resources
- Frequently asked questions
Key takeaways
Seven numbers you can pull yourself in about 30 minutes, and what each one tells you about whether your agency is working.
- Amazon defines advertising cost of sales (ACoS) as ad spend divided by ad revenue, so it ignores every sale your ads didn't touch.
- One seller reported 55% of November sales came from ads, and 61% of December sales so far.
- Amazon told another seller that ad-attributed sales can include your brand's products sold through other sellers.
- Marketplace Pulse found in 2023 that private label sellers often spend more than 10% of sales on advertising.
- Since March 25, 2026, prompts on Sponsored Products and Sponsored Brands campaigns bill per click, with campaigns enrolled automatically.
Two sellers answered the same Sellers Ask Sellers thread on November 19, 2025. One wrote: "our sales increased and our ad spend dropped by more than double their fee."
The other wrote: "after 4 months our sales dropped in half and costs went up during their 'ad testing phase.'"
How do you know if your Amazon pay-per-click (PPC) agency is working? Check seven numbers yourself. Start with total sales and total advertising cost of sales (TACoS). Then check ad share of sales, branded spend, wasted spend, profit after ads, and spend in placements you never chose. If your agency's report skips one, ask why.
Run the check in five steps
- Export 12 months of Business Reports by month from Seller Central.
- Export the same months of campaign, search term, and placement reports from the Ads Console.
- Work out the seven numbers below in one sheet.
- Put each one next to what your agency's report shows.
- Send the agency one question for every number its report leaves out.
Most agency reports open with ACoS and return on ad spend (ROAS). Both only see ad-attributed sales. Our PPC guide calls total ACoS the number that matters most for the long game, and the seven checks below build out from it.
A seller asked the core question on Seller Forums years ago. "My concern is how do you know they are doing the job your hired them for." These seven numbers are our answer.
The example numbers throughout come from one made-up account, not client data, so you can follow the math from section to section.
Start with total sales, not ad sales
Ad-attributed sales are your agency's number. Total sales are yours.
Total sales live in Seller Central under Business Reports, as ordered product sales. That figure counts every order, from ads or not. Put it next to the ad sales your agency reports, month by month.
| Month (example) | Ad sales in the agency report | Total sales in Business Reports |
|---|---|---|
| July | $42,000 | $180,000 |
| August | $46,000 | $170,000 |
| September | $50,000 | $160,000 |
Example account, not client data.
Use the same dates and the same marketplace in both tools. A report that mixes the US and Canada will never line up with a US-only Business Report.
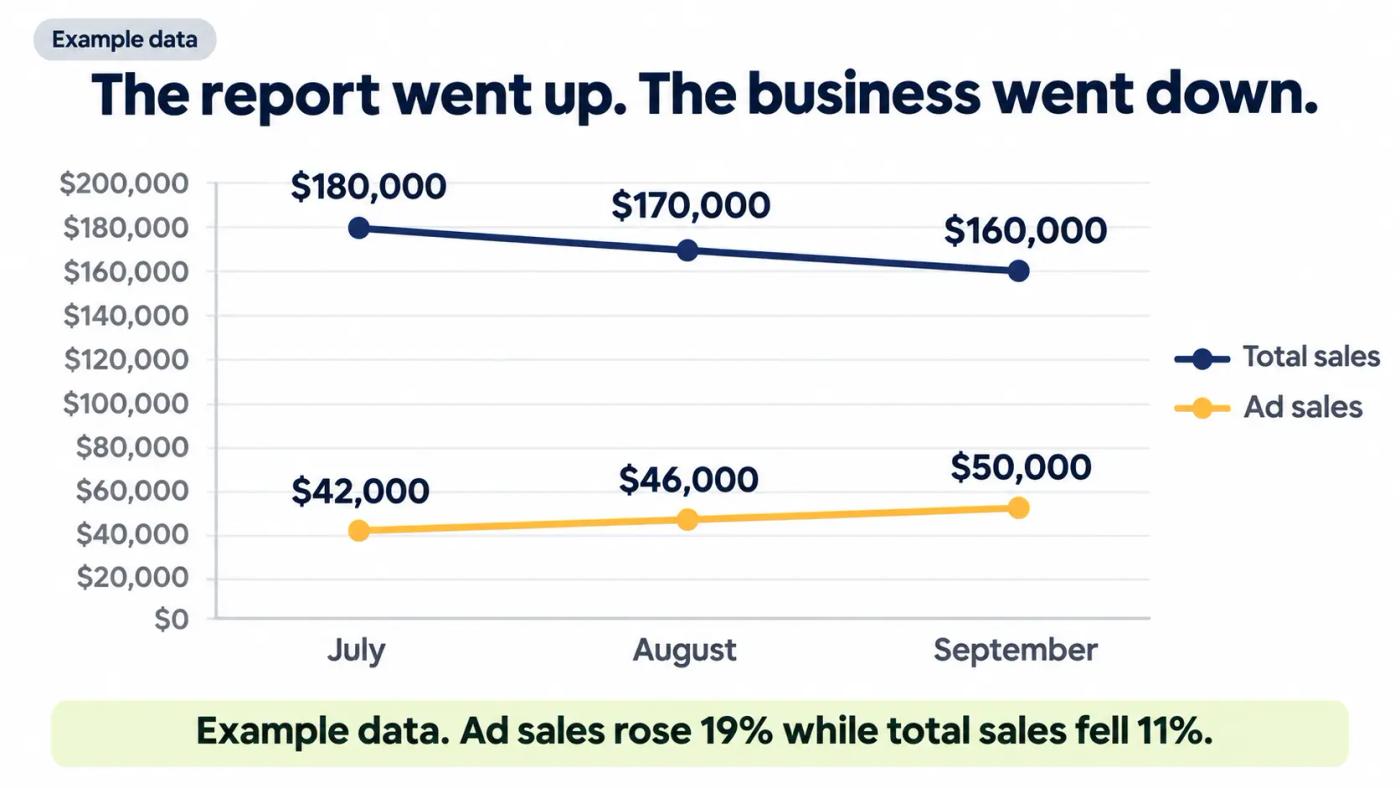
In this example, ad sales rose 19% from July to September. Total sales fell 11% over the same months. A report that shows only the first line reads as good news.
Compare each month with the same month last year too, so a seasonal dip doesn't look like an agency problem. Side-by-side columns like these are what transparent reporting looks like in practice, and our agency guide for 7-figure brands covers the rest.
Ask for it in writing
One email fixes most reports. Ask: "Please put total sales from Business Reports next to ad sales on page one, for this year and last year." A good agency adds the column by the next report. If the answer is that total sales aren't their job, you've learned what they're measuring.
Do this: Export 12 months of Business Reports by month. Put total sales in the column next to your agency's ad sales.
Track TACoS, because ACoS can't see the whole account
TACoS is your ad spend divided by your total sales.
Amazon's ACoS guide gives the formula for the agency's favorite number: "ACOS = (ad spend ÷ ad revenue) x 100." TACoS swaps ad revenue for total sales, so it moves when organic sales move.
| Month (example) | Ad spend | ACoS | TACoS |
|---|---|---|---|
| July | $16,200 | 38.6% | 9.0% |
| August | $18,700 | 40.7% | 11.0% |
| September | $20,000 | 40.0% | 12.5% |
Example account. ACoS uses the ad sales above. TACoS uses total sales.
Use ad spend from every ad type: Sponsored Products, Sponsored Brands, and Sponsored Display. A report that covers only Sponsored Products can make TACoS look lower than it is.
ACoS held near 40% all quarter. TACoS climbed from 9.0% to 12.5%. The account paid more for every dollar of sales, and the agency's headline number never showed it.
For context, Marketplace Pulse reported on February 13, 2023 that private label sellers "often spend more than 10% on growing their brands." Its sample of seller P&Ls also found "many resellers spend less than 5% of sales." The top of its range was "up to 15% for advertising and promotions on Amazon." Those are sample figures, not targets.
Read TACoS with total sales
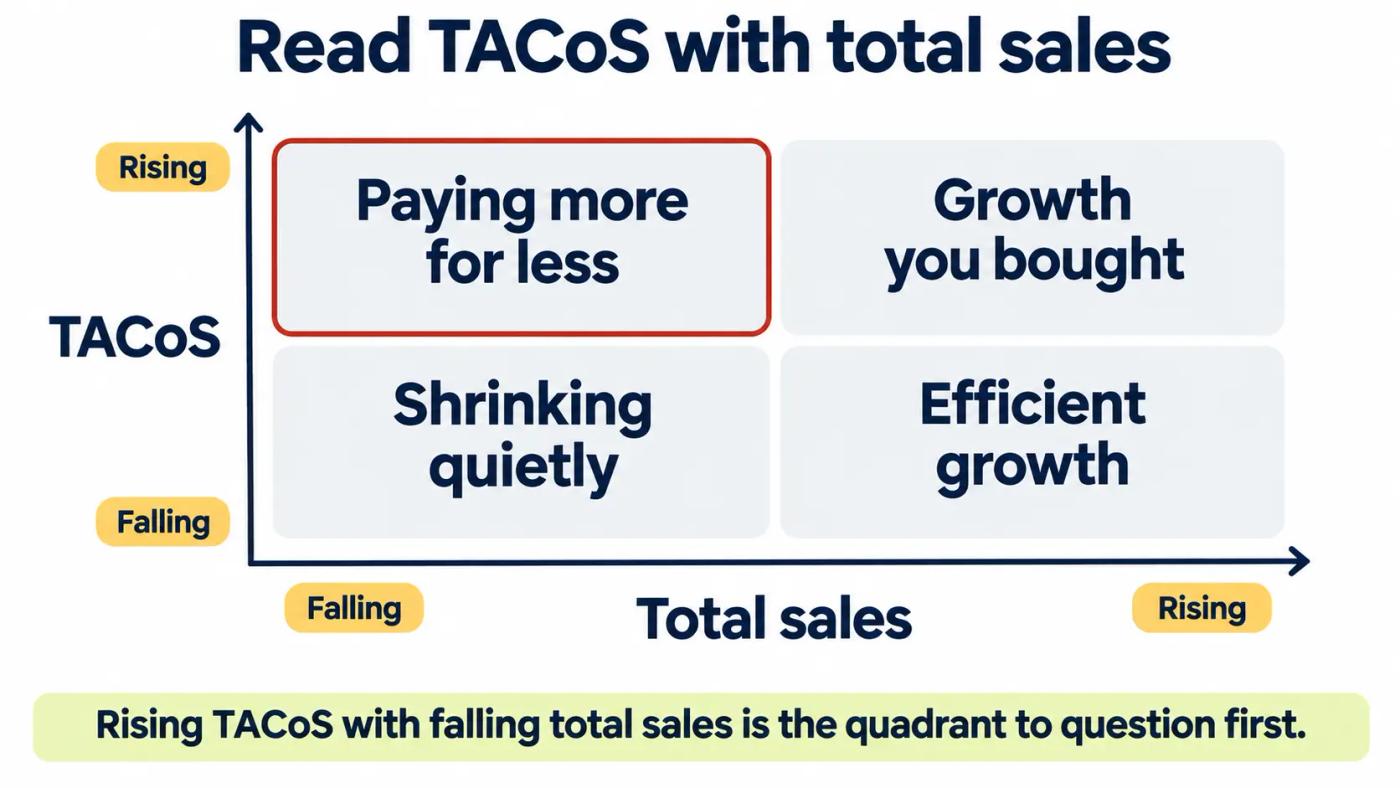
My working model: rising TACoS with rising total sales can be growth you chose to buy. Rising TACoS with falling total sales means you're paying more for less.
Some reasons for a rise are fair: a launch, a new product line, a price cut, or a planned push before a sale event. Each should be in the agency's plan before it shows up in the numbers. If your TACoS sits in the top left box and nobody planned it, an Amazon strategy session is a quick second read.
Do this: Work out TACoS for each of the last 12 months. Mark every month where TACoS rose and total sales fell.
Find out how much of your sales the ads are carrying
Divide ad-attributed sales by total sales. That share tells you how much of the business would wobble if the ads stopped.
In the example, the share rose from 23% in July to 27% in August and 31% in September. Organic sales are shrinking under the ads. When ad share climbs while total sales fall, the ads are replacing organic orders rather than adding new ones. Ask for this share every month, next to the organic share.
Sellers see this in their own accounts. In a Seller Forums thread from about 2024, one seller reported "55% from Ads; 45% from Organic" for November. For December so far: "61% from Ads; 39% from Organic."
Check for days above 100%
Sometimes the share goes past 100%. One seller hit this in a January 2026 Seller Forums thread. "We ended up with more ad sales in December than sales and noticed it on individual days as well."
The seller quoted Amazon's case reply: "Ad-attributed sales can include purchases of your brand's products made through other sellers." So a reseller's orders on your listing can count as your ad sales.
One day above 100% can be timing. A pattern across a week or a month is the problem. If it repeats, compare ad spend by product with the Featured Offer percentage in Business Reports. Ask your agency why ads run where another seller wins the sale.
Do this: Work out ad share of sales by month. Then check by day, and flag any day above 100% for your agency to explain.
Strip out your brand name before you judge ROAS
Searches for your own brand make any agency look good.
A shopper who types your brand name was already looking for you. Ads on those searches still claim the sale. Our Search Query Performance (SQP) guide shows how to spot a cannibalized sale, where an ad takes credit for an order you'd have won anyway.
| September (example) | Ad spend | Ad sales | ROAS | ACoS |
|---|---|---|---|---|
| Brand terms | $4,000 | $22,000 | 5.5 | 18.2% |
| Everything else | $16,000 | $28,000 | 1.75 | 57.1% |
| Blended | $20,000 | $50,000 | 2.5 | 40.0% |
Example account. ROAS = ad sales ÷ ad spend.
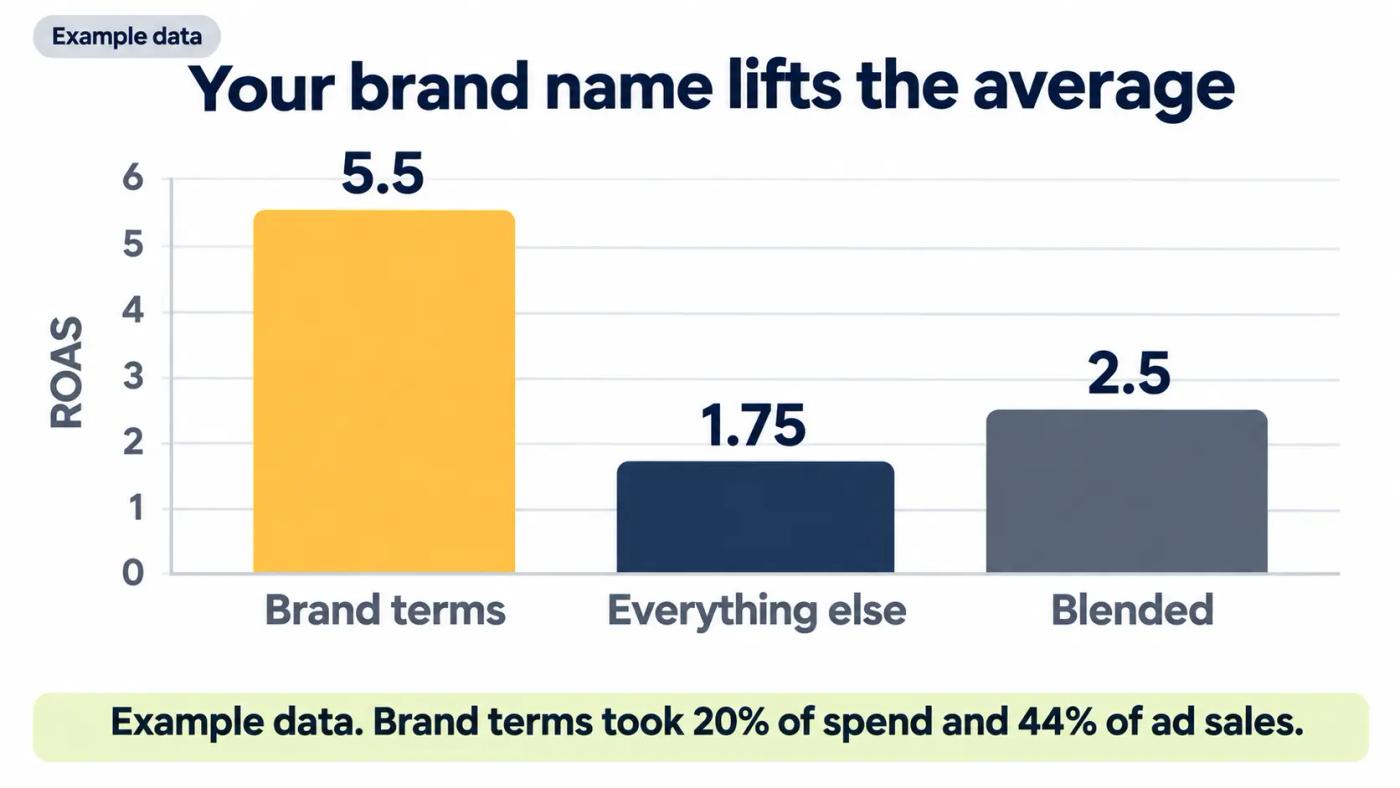
Brand terms took 20% of spend but 44% of ad sales. The blended 2.5 ROAS hides a 1.75 on the searches where the agency had to find new buyers.
My read: the non-branded line is the agency's real work. Ask for it on its own.
Count your brand terms the same way every month
Brand terms include your brand name, its common misspellings, and searches that pair your brand with a product type. Ads that target your own product pages belong in the same bucket. Write the list down once, so the split means the same thing every month.
Do this: Filter the search term report for your brand name and its misspellings. Work out spend, ad sales, and ROAS with and without them.
Add up the search terms that never sold
Every account has search terms that take clicks and never sell. The question is how long they keep spending.
Sort 60 days of the search term report by spend, then filter for zero orders. Judge each term only after enough clicks to rule out bad luck.
My working rule is 3 divided by your conversion rate. At a 10% conversion rate, that's 30 clicks. At a $1.50 cost per click (CPC), a term can spend $45 before you judge it.
Use your own ad conversion rate: orders divided by clicks, from the same 60 days of the search term report. An account average borrowed from another brand will set the line in the wrong place.
In the example, terms past that line with zero orders spent $2,600 in September. That's 13% of the $20,000 budget.
Check whether the waste stops
One month of waste is normal. The same terms spending again next month is the warning sign. Compare this month's zero-order list with last month's. Any term on both lists should already be a negative keyword, or the agency should be able to say why it isn't.
Do this: Total the spend on terms past your click line with zero orders. Ask your agency when each one was last reviewed.
Measure profit after ads and fees
Sales can grow while profit shrinks. Ad reports leave out the costs that decide which.
Amazon's ACoS guide says "Break-even ACOS is directly linked to your profit margin." It adds that ACoS has to stay below your margin to keep a profit.
| September (example) | Amount |
|---|---|
| Total sales | $160,000 |
| Cost of goods sold (COGS) | -$48,000 |
| Amazon fees | -$45,000 |
| Ad spend | -$20,000 |
| Agency fee | -$3,000 |
| Profit after ads and fees | $44,000 (27.5%) |
Example account. Use your own COGS and fees.
For scale, Marketplace Pulse's 2023 sample found "50% is the cost of selling on Amazon," counting fees and advertising. In the example, fees and ads come to 40.6% of sales.
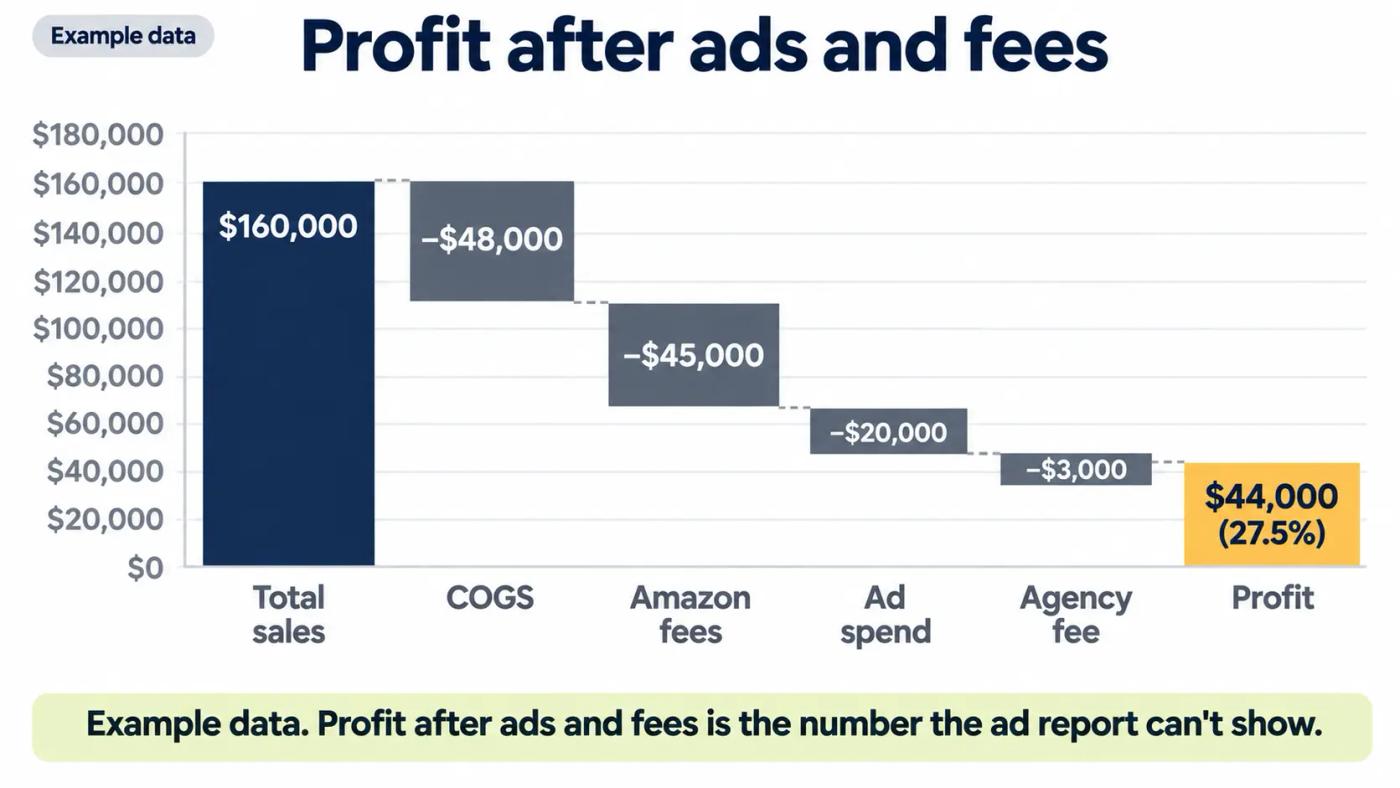
Check how your agency's fee moves, too. The seller who lost money paid "$500 a month plus 3% of sales." On $160,000 in sales, that's $5,300 a month. Fees tied to sales or a percentage of ad spend grow with volume, whether profit does or not.
For the full set of costs behind this table, see how we work out the true cost of PPC for a brand.
Put the fee next to the profit
In the example, profit before the agency fee is $47,000. A $3,000 flat fee takes 6.4% of it. The $5,300 fee under that seller's old pricing would take 11.3%. Neither is wrong on its own. Track the share each month, so you can see whether the fee grows faster than the profit it is paid from.
Do this: Fill in this table for the last six months. If profit after ads and fees fell while ad sales rose, take it to the agency first.
Price the placements nobody chose
Some of your spend may go to placements Amazon switched on, not ones your agency picked.
PPC Land reported on March 28, 2026 that "Sponsored Products and Sponsored Brands campaigns will be automatically enrolled in prompts without any additional setup required." Prompts are sponsored questions written by artificial intelligence (AI), billed per click from March 25, 2026.
Off-Amazon reach works the same way. PPC Land reported on August 4, 2026 that Sponsored Products campaigns were enrolled in creator placements by default from August 10, 2026. Those results sit in the placement report, on the off-Amazon row.
In the example, prompts spent $900 for $1,500 in sales, a 60% ACoS. Off-Amazon placements spent $1,100 for $1,000, a 110% ACoS. Together that's $2,000, or 10% of September's spend.
My read: a default isn't wrong because Amazon picked it. It's wrong when it runs above your break-even and nobody notices.
Ask which placements were chosen
Send one question: "Which of our prompts, video, and off-Amazon placements did you turn on, and which were on by default?" Video belongs on the list. In a June 2026 Seller Forums thread, a seller found an assembled video setting "toggled ON" across their Sponsored Products campaigns. A clear answer names each placement and its results. A vague one means nobody has looked.
Do this: Pull the Prompts report and the placement report's off-Amazon row. Ask your agency which of these it chose on purpose.
What you can't fix
You can't judge an agency on one month. Sales swing with season, stock, and price.
You can't see everything from reports. Bid changes, negatives, and listing fixes don't show up as numbers, so ask what was done, not only what happened.
You can't compare your TACoS with another brand's. Margins, prices, and launch stage differ.
You can't treat these seven numbers as a verdict. They tell you which questions to ask first.
And one limit on our side: this post uses public sources and one made-up example account. We haven't published an anonymized teardown of a real agency report yet.
Your 30-minute agency checklist
- Total sales by month for 12 months, next to the agency's ad sales
- TACoS by month, with months of rising TACoS and falling sales marked
- Ad share of total sales by month, and any day above 100%
- Spend, ad sales, and ROAS with and without brand terms
- Spend on search terms past your click line with zero orders
- Profit after ads and fees for six months
- Spend and ACoS for prompts and off-Amazon placements
- One written question to the agency for each gap
Where we fit
Full disclosure: Amplivus is an Amazon PPC agency too, so read this list with that in mind. We charge a flat monthly fee, never a cut of your ad spend.
Want a second opinion on your seven numbers? Send them to us. Within 24 hours you get a free written diagnosis with a prioritized action list. No pitch.
If you spend under $10K a month on ads, run the checklist yourself first. You may not need anyone.
Authoritative resources
- Sellers Ask Sellers agency threadTwo sellers, two very different agency results.
- Seller Forums agency questionA seller asks how to know an agency is doing the job.
- Amazon ACoS guideAmazon's ACoS and ROAS formulas and the break-even link.
- Seller Forums ad share threadOne seller's split of sales from ads and organic.
- Seller Forums other-sellers threadAd sales above total sales, and Amazon's reply.
- Marketplace Pulse on seller costsAdvertising as a share of sales in a sample of seller P&Ls.
- PPC Land on billable promptsAutomatic enrollment and billing from March 25, 2026.