
In this guide
Key takeaways
Mismanagement rarely shows up as a single disaster; it is a steady leak of wasted spend, uncaptured sales, and eroded margin that a large account can hide for a long time.
- The cost is not one number but four: wasted spend, overpaid bids, lost incremental sales, and margin eroded by wrong targets.
- At $1M+ the leak hides in plain sight, because the account still looks busy and profitable on the surface while quietly underperforming.
- On an illustrative $150,000 annual ad budget, the combined cost of common mismanagement can run well into five figures a year.
- The organic halo makes it worse, because weak paid management drags down the organic rank that should be lifting free sales.
- The fix usually costs a fraction of the leak, which is why an audit that finds your real numbers pays for itself quickly.
Most brands do not lose money on Amazon in one dramatic mistake. They lose it slowly, in the gap between how their advertising is run and how it should be run, and at seven figures that gap is large enough to matter. The account still looks healthy, so the leak goes unnoticed for quarters at a time.
This is a calculation, not a scare story. Using an illustrative $1M brand, it walks through what mismanagement actually costs, bucket by bucket, so you can estimate your own exposure. The numbers here are examples with stated assumptions, and the patterns behind them are the ones that drain seven-figure Amazon brands every day.
What Does PPC Mismanagement Actually Cost?
Mismanagement costs money in four ways: spend wasted on clicks that never convert, bids paid above what a term is worth, profitable demand left uncaptured, and margin eroded by targets that ignore your real economics. Each one is small enough to overlook and large enough to hurt when added up.
None of these show as a line item called waste. They are spread across thousands of search terms, dozens of campaigns, and a dashboard that reports an average, so the account looks fine while each bucket quietly leaks. That is exactly why the cost is so easy to miss and so worth calculating.
There is also a fifth cost that resists a tidy number: the organic halo, where weak paid management drags down the free rank it should be lifting. It is real enough to include, even if it is variable enough to keep out of the headline total, and it makes every figure below a floor rather than a ceiling. A brand that ignores it will always understate what mismanagement is truly costing.
The scale of the platform is part of the problem. With Amazon's advertising business now past $21 billion in a single quarter, competition and click prices are high enough that inefficiency compounds fast. A point of waste that was trivial at $10,000 a month is real money at seven figures.
The Calculation for a $1M+ Brand
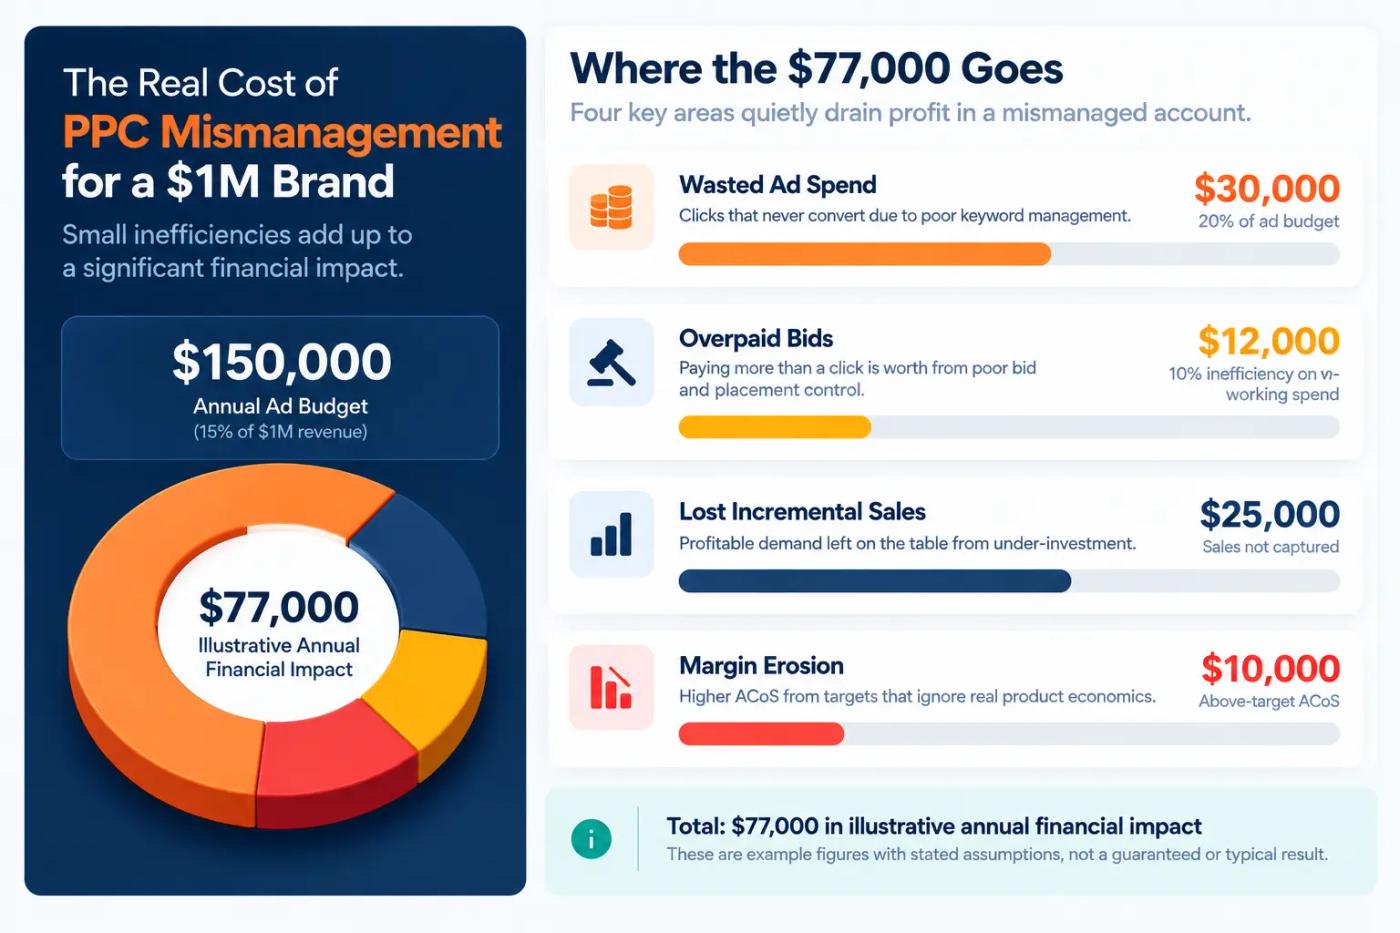
To make this concrete, take an illustrative brand doing $1M a year with a $150,000 annual ad budget, roughly 15% of revenue. The figures below are examples with clear assumptions, not benchmarks, so treat them as a model to run against your own account rather than fixed truths.
The 15% starting point is deliberately ordinary. A seven-figure brand often spends somewhere between 10% and 20% of revenue on Amazon Ads once you count every ad type, a range our breakdown of what Amazon PPC costs lays out, so the dollar figures below scale up or down with your own budget. Read the percentages as the durable part and the dollars as an example.
| Cost bucket | Illustrative assumption | Annual cost |
|---|---|---|
| Wasted spend | 20% of budget on non-converting terms | $30,000 |
| Overpaid bids | 10% inefficiency on the working spend | $12,000 |
| Lost incremental sales | Profitable demand left uncaptured | $25,000 |
| Margin erosion | Above-target ACoS on part of spend | $10,000 |
| Organic halo loss | Weaker rank from weak paid | Real but variable |
Wasted spend on non-converting terms
The first and most visible cost is spend on clicks that never convert. Without disciplined negatives and a weekly search-term review, a broad campaign keeps paying for irrelevant queries, and Amazon's own Sponsored Products best practices exist precisely to catch this. Suppose 20% of a $150,000 budget leaks this way, and that is $30,000 a year spent on nothing.
The number is rarely lower in a neglected account. Search behavior shifts constantly, new irrelevant terms appear every week, and an account that is not pruned regularly drifts toward more waste, not less. The 20% assumption is conservative for an account no one is actively cleaning.
The fix is unglamorous and specific. Reading the search term report every week, promoting the converting queries and blocking the rest, is what keeps this bucket from filling, and it is exactly the routine a neglected account skips. Miss it for a quarter and the waste does not hold steady, it grows, because nothing is stopping the new irrelevant terms from spending.
Overpaying on bids and placements
The second cost is paying more than a click is worth. When dynamic bidding is set carelessly or placement modifiers are left untouched, an account wins impressions at prices that never pay back. On the working portion of the budget, a 10% inefficiency on roughly $120,000 is about $12,000 a year handed to the auction for no extra return.
This bucket hides well because the spend does convert, just not efficiently. The dashboard shows sales, so nothing looks broken, while the account quietly pays a premium on placements and hours that a senior strategist would bid down.
Placement is where this cost concentrates. Top of search often converts, but it also carries the highest cost per click, so paying full price there without checking whether the return justifies it is one of the most common ways a large account overspends without noticing. The same is true of the hours nobody dayparts and the campaigns that never got a bid review.
Lost incremental sales from under-investment
The third cost is the mirror image of the first: profitable demand you never capture. Mismanaged accounts often underfund their best terms while overspending on their worst, so real sales go to competitors. Recovering even a slice of that, the kind of upside covered in scaling an account past six figures a month, is worth tens of thousands in contribution margin a year.
This is the hardest cost to see because it never appears on any report. You cannot spend a line item on sales you did not make, so the loss is invisible unless someone measures what the account could have earned against what it did.
Under-investment usually comes from fear of a higher ACoS. A manager protecting a vanity number refuses to bid up a term that would still be profitable at a slightly higher cost, and the sales that term would have produced simply go to a competitor who was willing to pay for them. On a lifetime-value catalog, that timidity costs far more than the ACoS it protects.
Margin erosion from wrong targets
The fourth cost is running the wrong target. A flat ACoS goal that ignores your fees and margins means part of the budget spends above break-even, losing money on every sale while the average still looks acceptable. On even a third of spend running eight points above target, the erosion adds up to roughly $10,000 a year in lost margin.
Reading your true profit by product, using the kind of signal inside Amazon Brand Analytics, is what turns a vanity ACoS into a target that actually protects the bottom line. Without it, the account optimizes to a number that quietly loses money.
Heavy or low-margin products make this sharper. A product with thin margins can only tolerate a low ACoS before every sale loses money, so a blanket target applied across a mixed catalog guarantees that some products are sold at a loss while the blended average still reads as healthy. The wider your price and margin range, the more a single flat target costs you.
The compounding organic halo loss
The fifth cost is the one that compounds. Paid and organic feed each other, so weak paid management drags down the organic rank that should be lifting free sales. That loss is real but variable, and it grows the longer mismanagement runs, because rank is slow to earn back once it slips.
The effect works in both directions, which is what makes it compound. Good paid management lifts organic rank, which lowers the paid cost of holding a position, which frees budget to lift rank further. Mismanagement runs that loop in reverse, so the longer it continues, the more expensive recovery becomes and the more of your sales you are quietly paying for that you should be earning free.
Adding It Up: The Total Cost
Summed on the illustrative model, the visible buckets alone reach roughly $77,000 a year on a $150,000 budget, before the organic halo loss is even counted. That is more than half the ad budget lost to inefficiency, and a meaningful share of a $1M brand's profit.
Your real figure will differ, and that is the point. The percentages here are examples, but the structure holds: every mismanaged seven-figure account leaks across these same buckets, and the total is almost always larger than the owner expects. Running the model against your own spend is the first honest step.
The pattern is consistent enough that established brands watching Amazon's ad changes should treat this calculation as routine, not exceptional. At this scale, an unmeasured account is almost certainly leaking somewhere on this list.
It helps to translate the total into contribution margin, not just spend. Wasted ad dollars come straight off the bottom line, and lost sales cost you their margin, so a $77,000 leak on a brand running a healthy net margin can be the difference between a strong year and a flat one. That framing is what moves the calculation from interesting to urgent, because it is not ad budget you are losing, it is profit.
Why Mismanagement Hides at $1M+
The cruel part is that a large account hides its own inefficiency. Revenue is high, spend is high, and the dashboard is full of activity, so the surface looks like success while the buckets leak underneath. Nobody sounds an alarm because nothing is obviously on fire.
Growth masks the leak too. A brand can be growing overall while its advertising quietly wastes a third of its budget, because rising demand covers the inefficiency. The account looks like it is winning, when it is really winning despite its advertising rather than because of it.
Averages finish the job. A blended ACoS that looks fine can hide fee-heavy products losing money and profitable terms starved of budget, because the good and the bad cancel out in the summary. Only looking underneath the average reveals the real cost.
That is what the data is for. Reading profit and search performance underneath the blended numbers, using Amazon Brand Analytics and the Search Query Performance report, is how a large brand catches the products and terms the average is hiding. Without that look underneath, the leak stays invisible by design, and invisible leaks never get fixed.
What the Fix Costs by Comparison
Set against the leak, the fix is usually cheap. A disciplined Amazon PPC management engagement or a serious in-house effort costs a fraction of the tens of thousands a mismanaged seven-figure account loses each year, which is why the math almost always favors fixing it.
Transparent pricing makes the comparison easy. When you can see clear PPC management pricing against your own estimated leak, the decision stops being about cost and becomes about which number is bigger, the fee or the waste it removes.
The comparison usually is not close. When a mismanaged seven-figure account is leaking well over $70,000 a year and a management fee is a fraction of that, the return on fixing it is not a marginal call but an obvious one. The only reason it goes unfixed is that the leak was never measured in the first place, so it never felt real.
How to Stop the Bleed
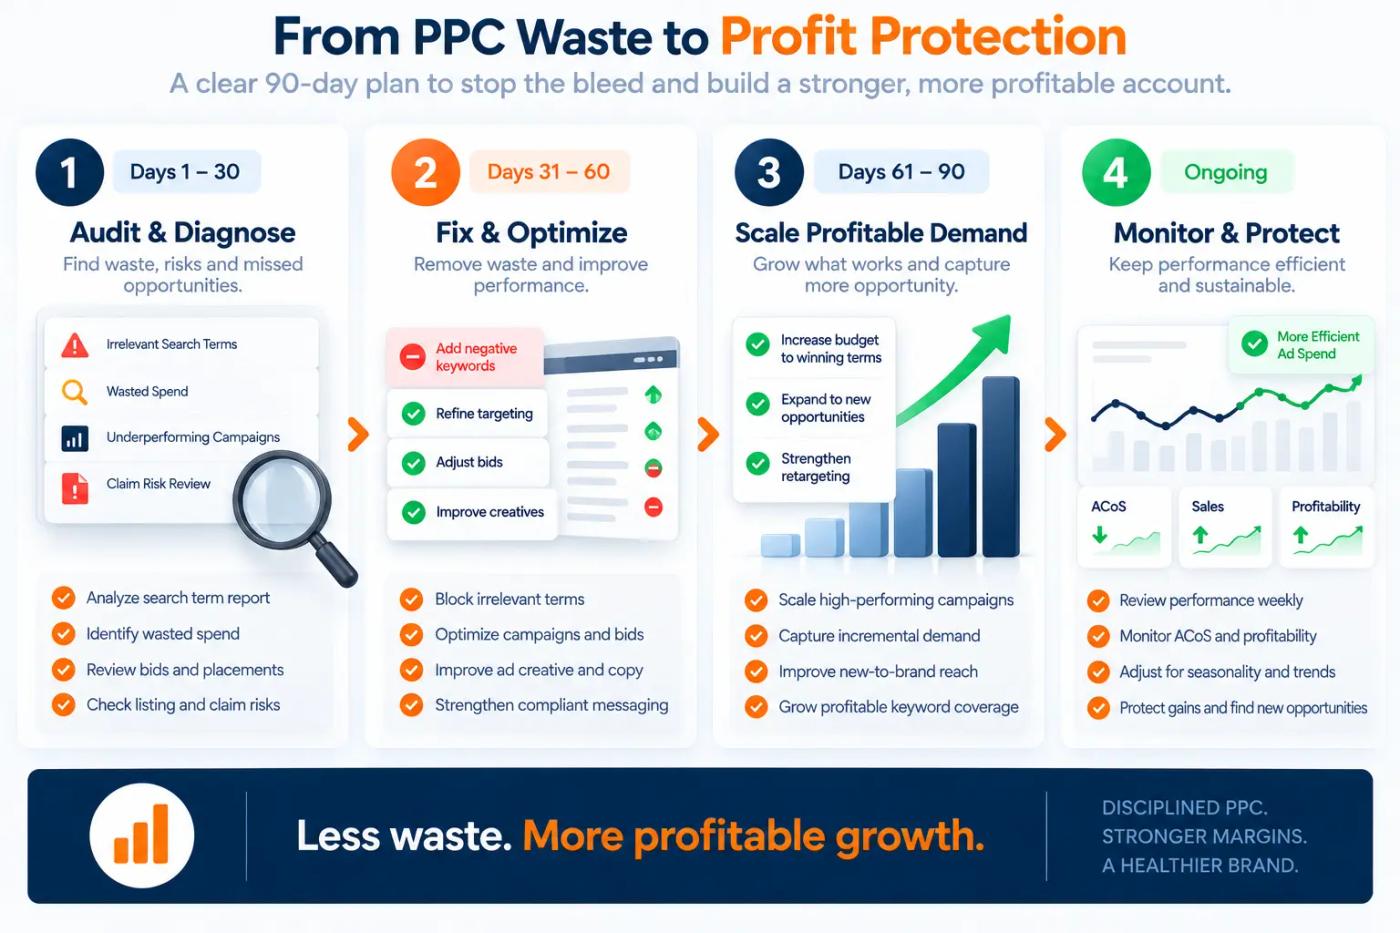
Start by finding your real numbers, because the model above is only a starting point. A focused Amazon PPC audit replaces the illustrative percentages with your actual wasted spend, your true break-even targets, and the terms you are underfunding.
From there, the fixes are the ordinary discipline of good management: prune waste weekly, bid to real economics, fund the winners, and measure incrementality with Amazon Marketing Cloud so you know what your spend truly caused. If you would rather have that assessment done for you, a short Amazon strategy session turns your audit into a plan.
None of this is exotic. It is the same weekly and monthly rhythm any disciplined account runs, applied consistently by someone who owns the outcome. The reason it works is not a secret tactic but the fact that it actually happens, week after week, instead of merely being intended. Mismanagement is rarely a lack of knowledge; it is a lack of the time and ownership to act on what everyone already knows.
The one option that always costs the most is doing nothing, because this leak does not close on its own. Every quarter an unmanaged account runs, the buckets keep filling, which is why the brands that treat this as urgent are the ones that keep their profit, a discipline the team at Amplivus builds every engagement around.
Authoritative resources
- Amazon Ads Sponsored Products best practicesThe data-first optimization that prevents wasted spend.
- Amazon Ads dynamic biddingHow bid strategy affects what you overpay.
- Amazon Ads keyword strategy and the search term reportWhere waste and harvesting opportunities live.
- Amazon Ads Amazon Marketing CloudMeasuring the true incremental value of spend.
- Amazon Brand AnalyticsThe Search Query Performance data that surfaces waste and profit.
- Amazon Investor Relations Q4 2025 resultsThe scale of Amazon advertising that makes inefficiency costly.